Walmart Sales Analysis
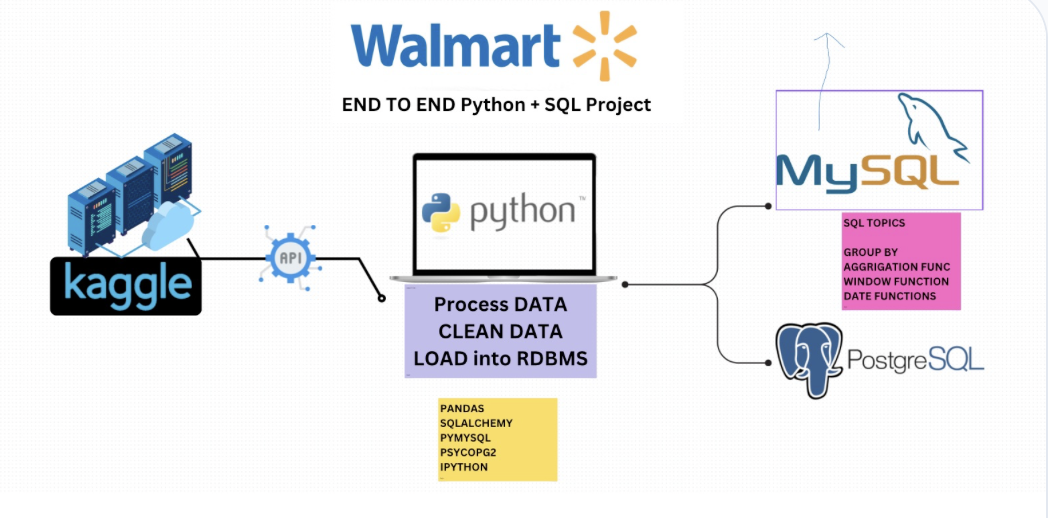
Retail performance deep dive turning transaction data into revenue and margin strategy.
- Revenue trend analysis
- Best-selling categories
- Customer buying patterns
- Profit margin insights
- Advanced SQL business queries
Motivated Data Analyst and MIS professional specializing in SQL, Python, Power BI, Tableau, and advanced Excel reporting. I turn raw operational data into MIS reports, dashboards, and insights leaders can act on.
Hi, I'm

Hire me as a |
0+
End-to-End Projects
0
Internship
0
Core Tools: SQL • Python • Power BI
0+
Interactive Dashboards
From business fundamentals to full-stack analytics — how I turn messy datasets into decisions.
I'm a BBA graduate from Chandigarh University who discovered that the business questions I loved answering were, at heart, data questions. That curiosity led me to the Data Analytics program at PW Skills, where I moved from spreadsheets into SQL, Python, and modern business intelligence.
Since then I've built a practical toolkit across analytics and visualization: designing ETL pipelines, cleaning and modeling raw data, running exploratory and statistical analysis, and shipping executive dashboards in Power BI, Tableau, and Excel — plus Streamlit applications backed by PostgreSQL.
My strength is translation. I read complex datasets, isolate what actually moves revenue, retention, or cost, and present it as a clear narrative stakeholders can act on — turning analysis into strategic business decisions rather than another chart.

2025
Data Analytics
PW Skills
Applied analytics program covering SQL, Python, BI and machine learning.
2023
Bachelor of Business Administration
Chandigarh University
CGPA 7.47
2020
Senior Secondary
Tender Heart Senior Secondary School
88%
A focused toolkit for analysis, business intelligence, reporting, and data storytelling.
Hands-on analytics delivery across pipelines, dashboards, and data applications.
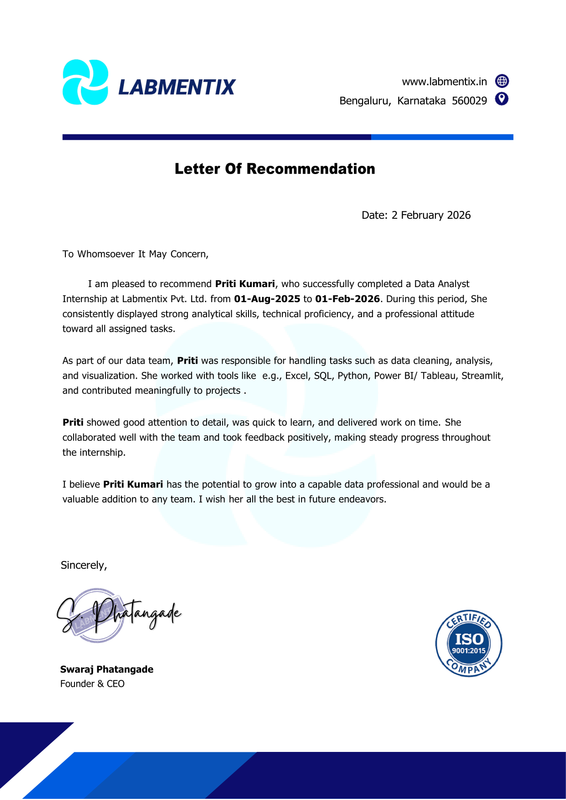
Labmentix
End-to-end analytics services, from raw data to boardroom-ready reporting.
Business insights from structured and unstructured datasets.
Complex querying, KPI generation, and business reporting.
Interactive executive dashboards with actionable KPIs.
Professional storytelling using dynamic visual analytics.
Advanced Excel reporting with Pivot Tables, XLOOKUP, SUMIFS, and automation.
Custom analytical web apps powered by Python and PostgreSQL.
Daily, weekly and monthly MIS reports with automated trackers, reconciliation and management summaries.
Analytics case studies spanning SQL, Python, Power BI, Tableau, Excel, and Streamlit.

Retail performance deep dive turning transaction data into revenue and margin strategy.


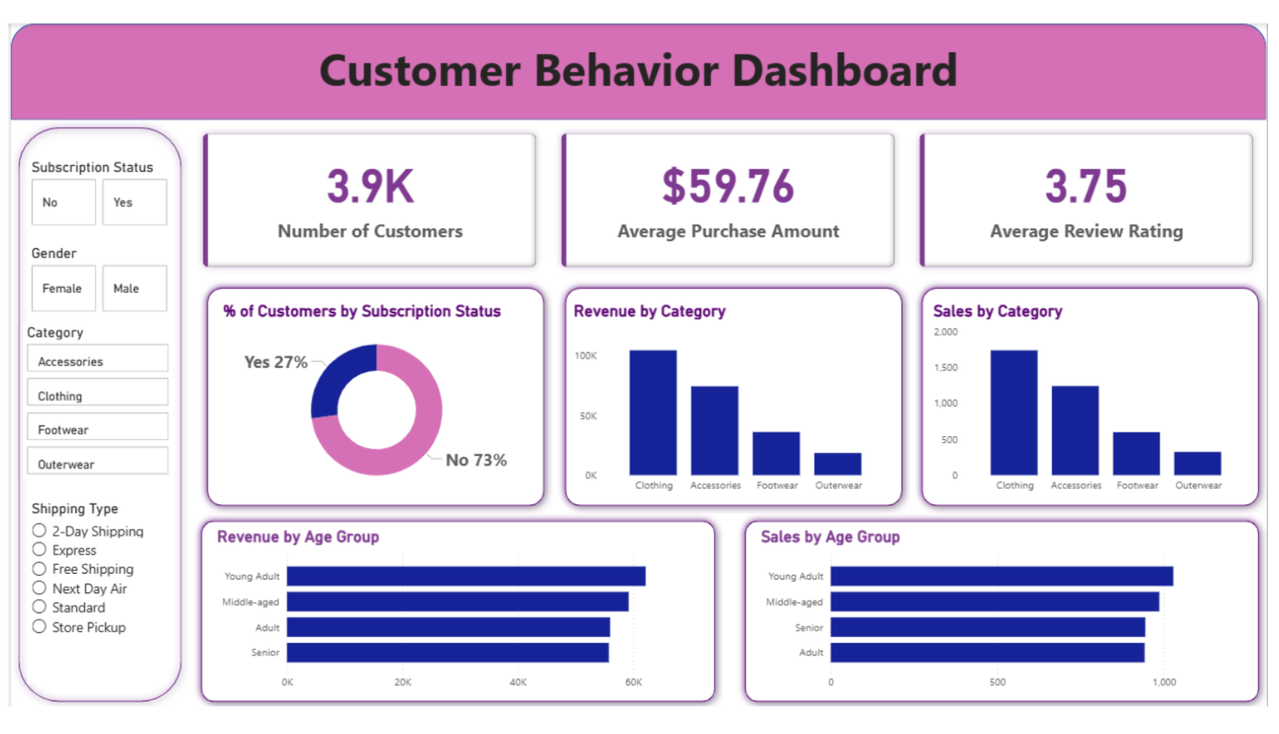
Segmentation and subscription analytics feeding an executive KPI dashboard.

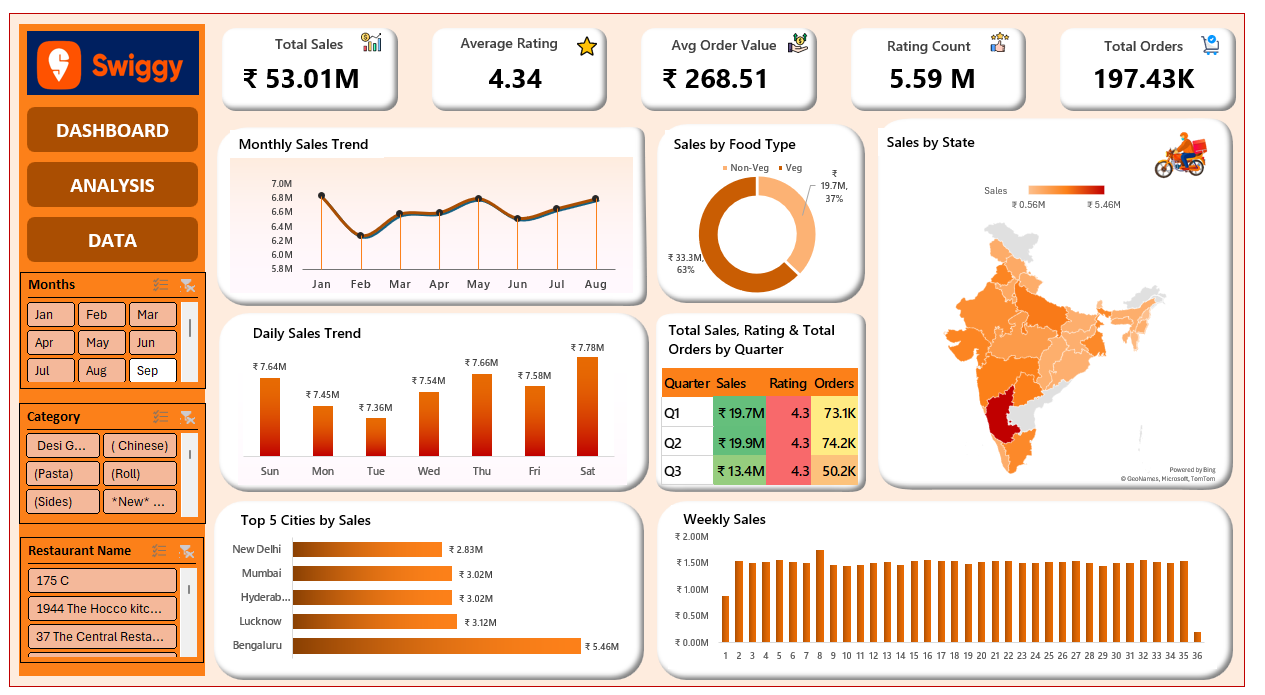
Advanced Excel sales dashboard with state-level performance breakdowns.
New analytics case studies are added regularly. Follow along on GitHub for the latest dashboards, SQL deep dives, and Streamlit applications.
Browse GitHubContinuous upskilling across analytics, AI, and professional practice. Click a certificate name to view it.
Open to Data Analyst, Business Intelligence, and MIS Executive opportunities.
Explore dashboards, code, and deployed data applications.